
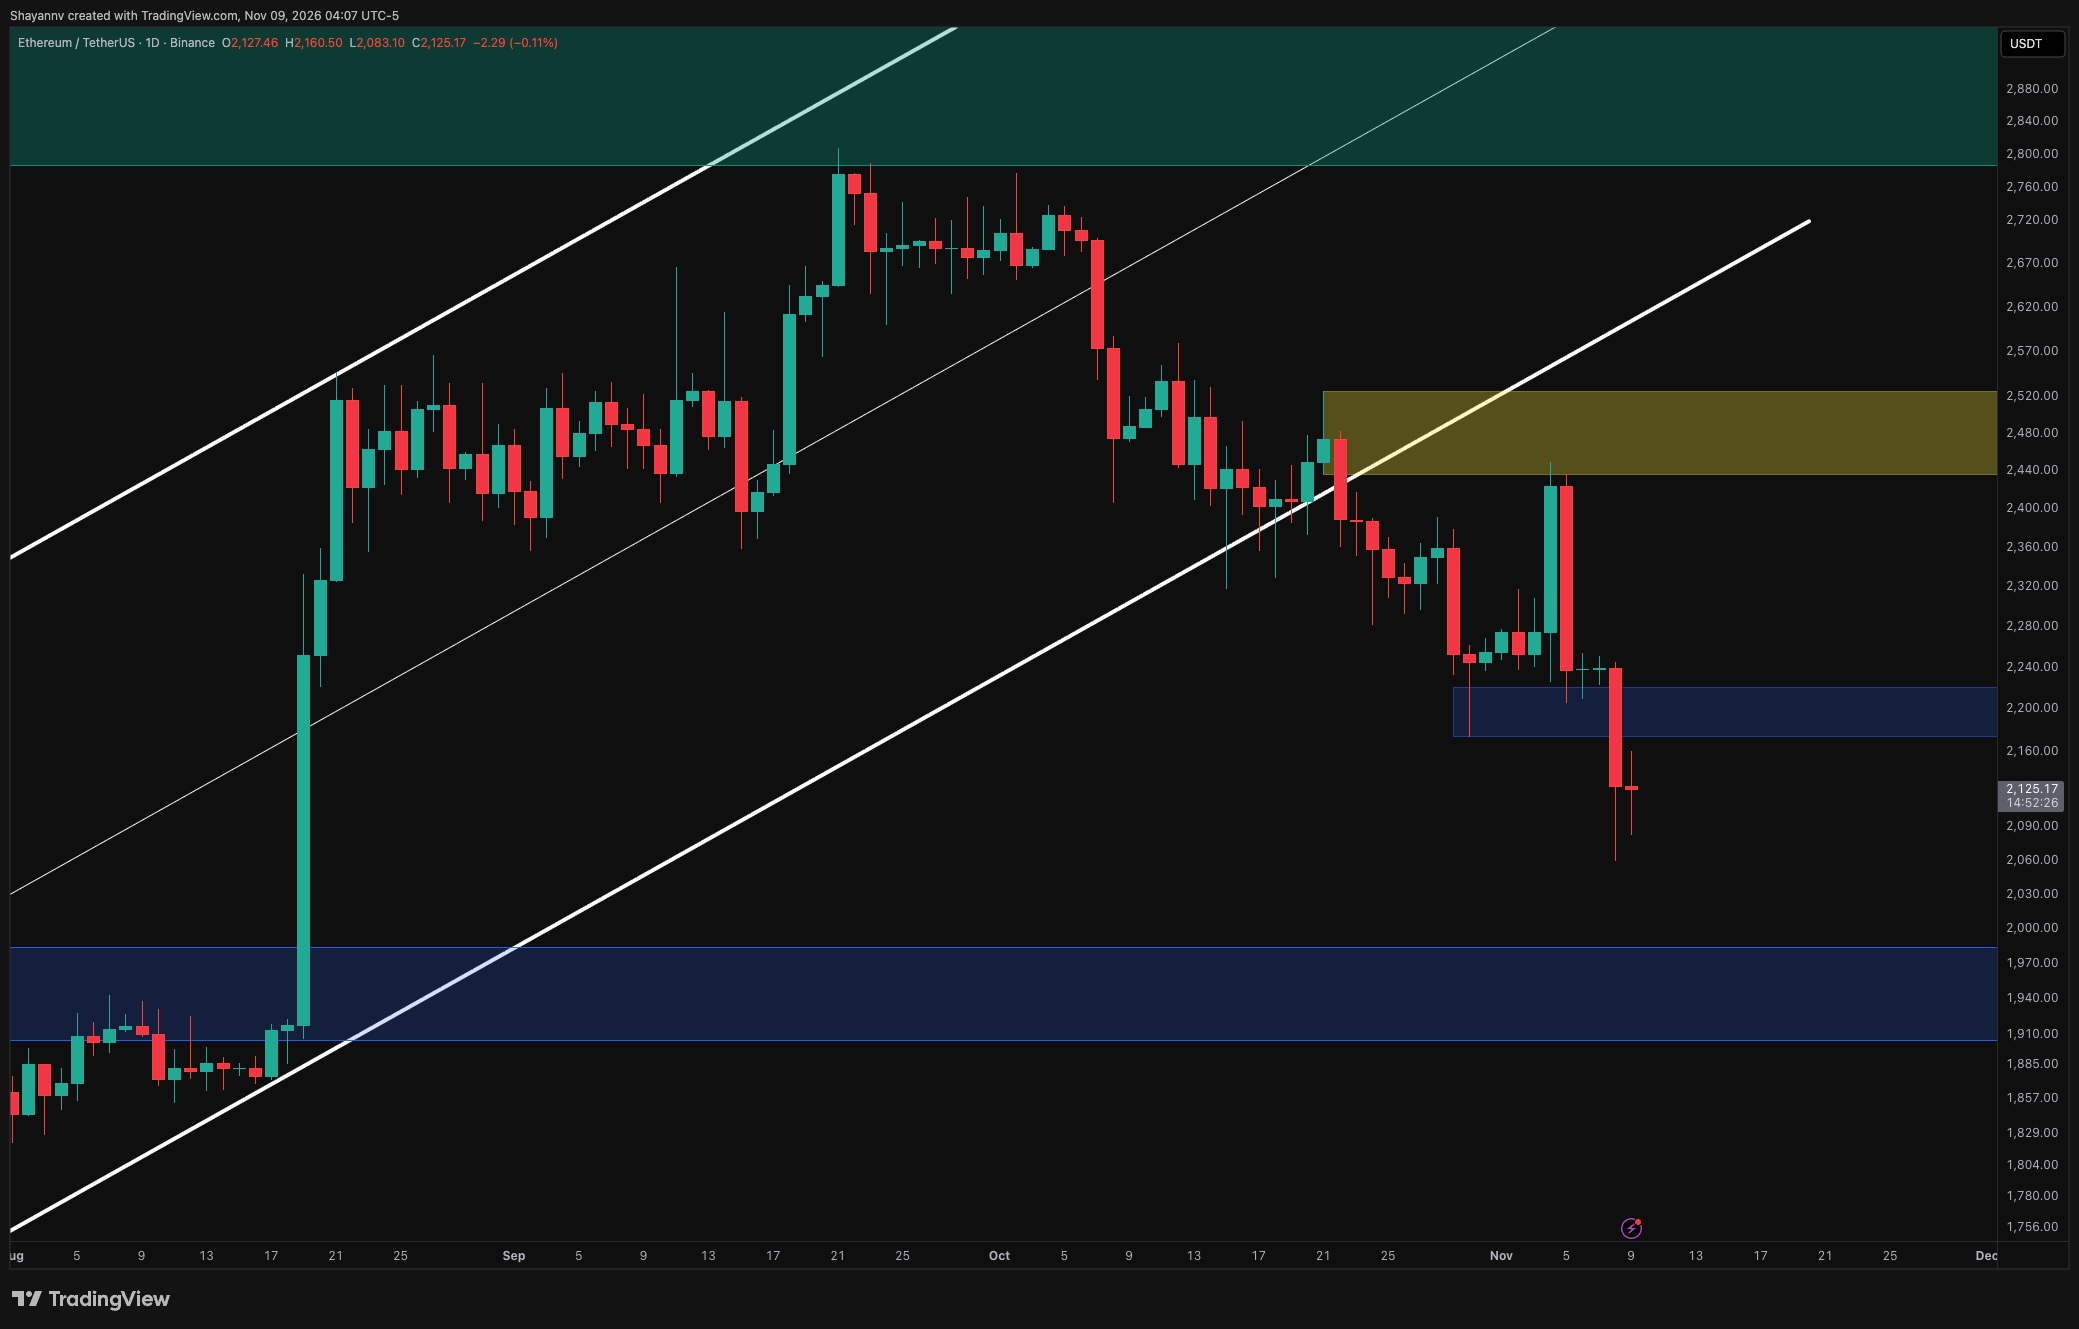
Ethereum’s decline has extended below the $2.17K–$2.22K support zone, leaving the price near $2.13K. The breakdown keeps the technical outlook bearish, while persistently positive funding suggests that bullish positioning has not fully unwound.
Ethereum Price Analysis: The Daily Chart
The daily chart shows another deterioration in Ethereum’s structure following its earlier breakdown from the ascending channel. The recent rebound toward $2.44K was sharply rejected at the lower edge of the $2.44K–$2.52K supply zone, confirming that sellers remain active on recoveries.
After briefly consolidating around $2.24K, ETH broke decisively beneath the $2.17K–$2.22K demand zone. This area now represents potential resistance on a pullback. Although the latest selloff produced a lower wick toward $2.06K, the subsequent response has yet to recover the broken support or establish a meaningful bullish structure.
If buyers fail to reclaim $2.17K–$2.22K, the risk of another decline remains elevated. The recent $2.06K low is the immediate downside reference, followed by the psychological $2K level and the broader $1.90K–$1.98K daily demand zone. Conversely, sustained acceptance back above $2.22K would weaken the latest breakdown and allow a recovery toward $2.28K–$2.36K.
ETH/USDT 4-Hour Chart
The four-hour chart highlights a failed breakout above the descending channel. Ethereum briefly surged through the upper boundary and reached the $2.44K supply area before reversing aggressively back inside the pattern. The failure to hold that breakout was followed by consolidation near $2.24K and another strong bearish expansion.
Price is now reacting near the descending channel’s lower boundary around $2.06K–$2.08K. This could support a temporary bounce, but the sequence of lower highs and lower lows remains intact. The marked $2.17K–$2.22K pullback zone is therefore the first important test for any recovery.
Rejection from that zone would reinforce its transition from support into resistance and could lead to another test of the recent lows. A sustained move beneath $2.06K would increase the risk of an extension toward $2K. Alternatively, reclaiming the pullback zone and overcoming the recent consolidation around $2.24K–$2.25K would ease immediate selling pressure, with the channel’s upper boundary near $2.30K becoming the next hurdle.

Sentiment Analysis
The funding chart displays the 14-period exponential moving average of Ethereum funding rates across exchanges. The smoothed rate remains positive, meaning longs continue to pay shorts on average despite the persistent price decline.
Following a sharp drop around the beginning of November, the funding average rebounded before turning slightly lower again. This recovery in funding was not accompanied by a sustained price recovery. The divergence suggests that willingness to maintain bullish perpetual futures exposure has persisted even as the spot price has weakened.
Positive funding alone does not establish excessive leverage or guarantee a liquidation event. However, alongside the support breakdown, it points to potential vulnerability among leveraged longs if Ethereum continues lower. A further funding reset could ease that pressure, while a recovery supported by stronger price structure would provide more convincing evidence of improving conditions than positive funding alone.

The post Ethereum Price Prediction: Is $2K Inevitable as ETH Crashes 5% Again? appeared first on CryptoPotato.