

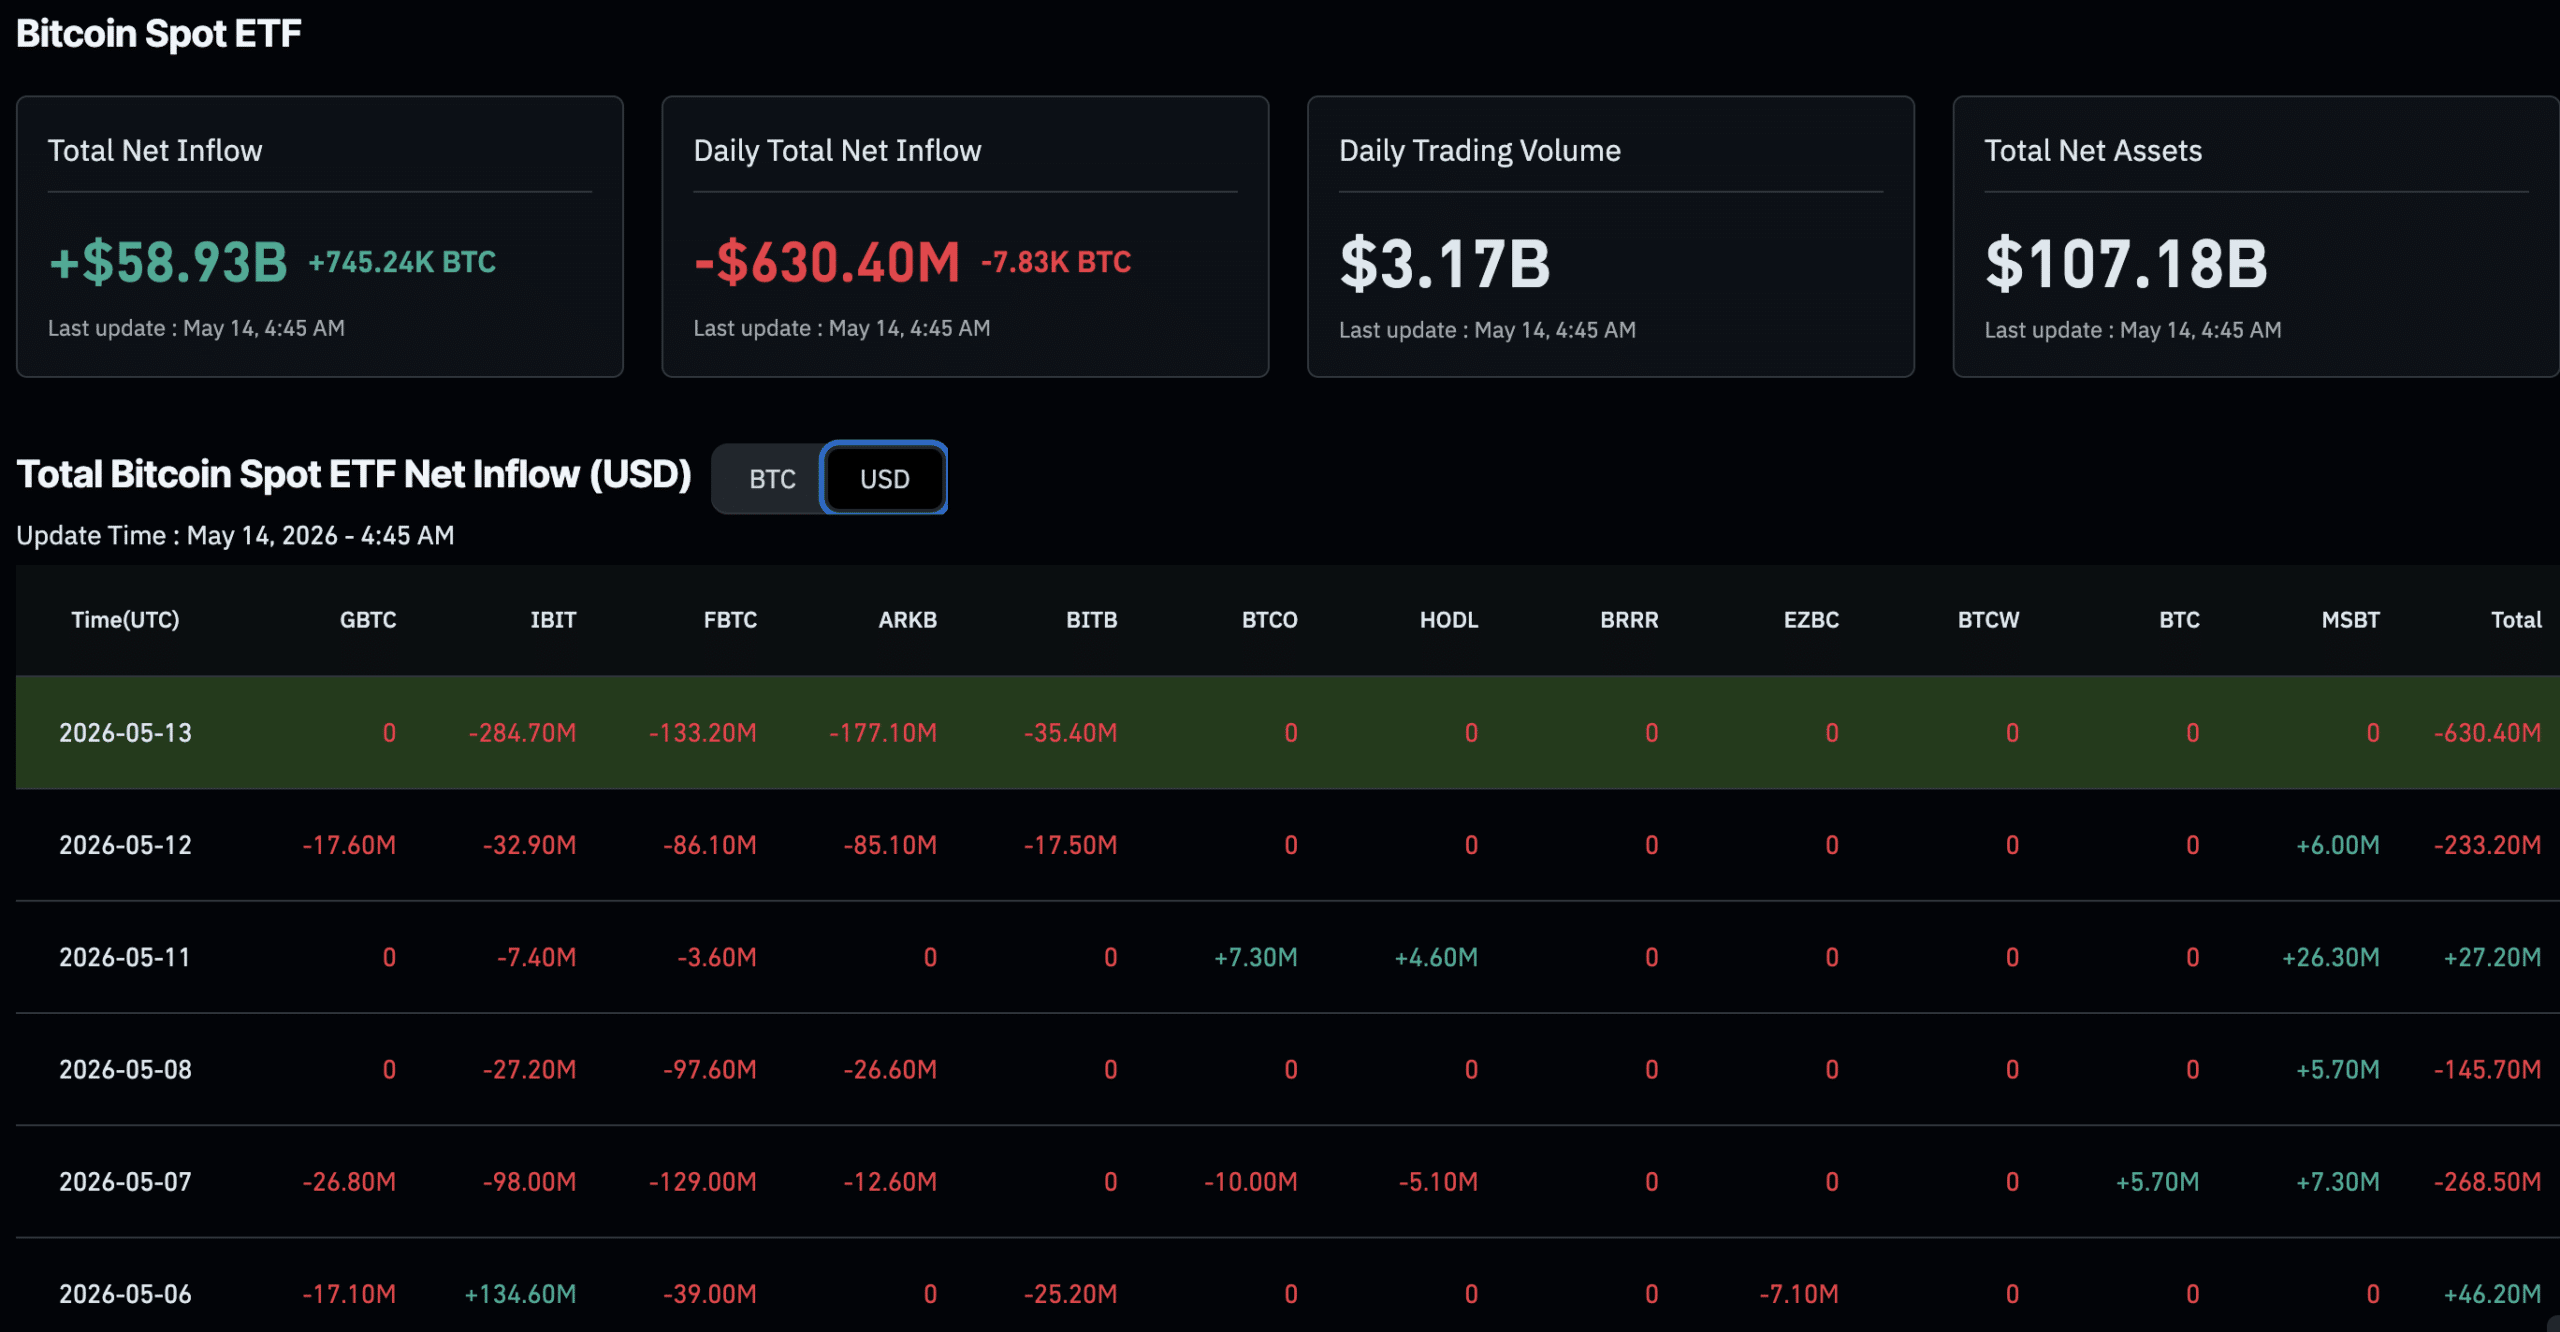
The US spot Bitcoin ETF products recorded a single-day outflow of $630M on Wednesday, the largest since January 29, bringing total redemptions over five trading days to $1.26Bn, according to data from SoSoValue.
The Bitcoin price slipped by more than 1.5% in the same window, touching $79,300, as renewed US inflation concerns weighed on sentiment, though it has since rebounded to $79,600 in an attempt to reclaim $80,000.
Here is the central tension this article unpacks: institutions poured $3.29Bn into these same ETFs through March and April, Bitcoin crossed the psychologically significant Bitcoin 100k threshold, and now that same money appears to be leaving.
Does that mean the rally is over? Not necessarily. The answer depends entirely on understanding what ETF outflows actually represent, and what they don’t.
Bitcoin ETF Outflows: What the $635M Number Actually Tells You
Think of a Bitcoin ETF like a parking garage near a sports stadium. On game day, the garage fills up fast – everyone wants in. When the game ends, cars flood out. The garage isn’t disappearing. The stadium isn’t closing. People are just leaving after the event they came for.
That is the plain-English version of what Bitcoin ETF inflows and outflows represent in a mature market cycle. Institutions buy in anticipation of a move, ride the rally, and then take profit. Wednesday’s $635M single-day exit is large in headline terms, but it sits inside a total net inflow base of $58.5 billion since the ETFs launched in January 2024.
What makes this moment more nuanced is a correlation shift that doesn’t make headlines but absolutely should. The 90-day rolling Pearson coefficient – a statistical measure of how closely ETF flows and BTC price move together, currently stands at just 0.16, down from a peak of 0.68 in February. A coefficient of 0.16 is statistically indistinguishable from zero.
Here is what that means in plain English: knowing whether ETF flows went up or down on a given day tells you almost nothing about which direction Bitcoin’s price moved. The once-tight leash between institutional money and BTC price has gone slack. That distinction is worth holding onto before drawing conclusions from a single day’s outflow number.
DISCOVER: 99Bitcoin’s Readers – Earn $10 USDC When You Sign Up for Binance
Institutional Profit Taking After a Historic Rally: Normal or Alarming?
Large outflows in the crypto market often indicate healthy conditions rather than problems. Following Bitcoin’s rise from $65,000 to over $80,000, institutional profit-taking was expected and necessary due to mandates and risk limits. The $630M that left the market on Wednesdays represented realized gains being recycled back into Bitcoin at lower prices.
Adam Haeems from Tesseract Group emphasized considering whether macro conditions remain supportive for Bitcoin’s next leg rather than if institutions are leaving. Currently, Bitcoin is stalling just below its 200-day moving average at around $82,000, needing sustained buying pressure to move higher.
Without favorable macro signals, the price may consolidate. Notably, the Nasdaq and S&P 500 reached new highs on the same day Bitcoin dropped, indicating the decline is Bitcoin-specific and driven by profit-taking rather than a broader market sell-off.
Bitcoin Price Prediction: Three Scenarios Worth Watching
$BTC Hanging on to that ~$79.4K level which marked the previous highs in April.
Pivotal level here in the short term.
The 4H 200MA/EMA are coming in below and will be catching up to price quickly too. pic.twitter.com/xc6q5023BX
— Daan Crypto Trades (@DaanCrypto) May 14, 2026
- Bull case: Inflation data cools, the Fed signals patience, and ETF flows stabilize above break-even. Bitcoin reclaims $82,000, breaks above the 200-day moving average, and targets the $88,000–$92,000 range. Institutional buying resumes as macro headwinds ease.
- Base case: Bitcoin consolidates in the $76,000–$82,000 range for two to four weeks. Outflows moderate but don’t reverse sharply. Price digests the post-$100K rally in a sideways pattern before the next catalyst – likely a Fed pivot signal or a fresh wave of institutional allocation – triggers the next leg.
- Bear/invalidation case: A persistently hot CPI print, combined with continued ETF outflows exceeding $300 million per day, breaks Bitcoin below $75,000. This would constitute a deeper technical reset, potentially targeting the $68,000–$72,000 demand zone where long-term holders historically step in. This scenario does not invalidate the bull cycle – it delays it.
The key variable in all three scenarios is the same one Adam Haeems identified: macro conditions. Watch Friday’s ETF flow data from SoSoValue and the next Federal Reserve inflation report as your two leading indicators. Those two data points will tell you more than any single day’s price move.
EXPLORE: Best Crypto Presales With Staking Rewards
Follow 99Bitcoins on X, YouTube, and Telegram for more crypto news and analysis.
The post Bitcoin ETF Outflows Hit $630M: Is BTC USD Going to $60K? appeared first on 99Bitcoins.