
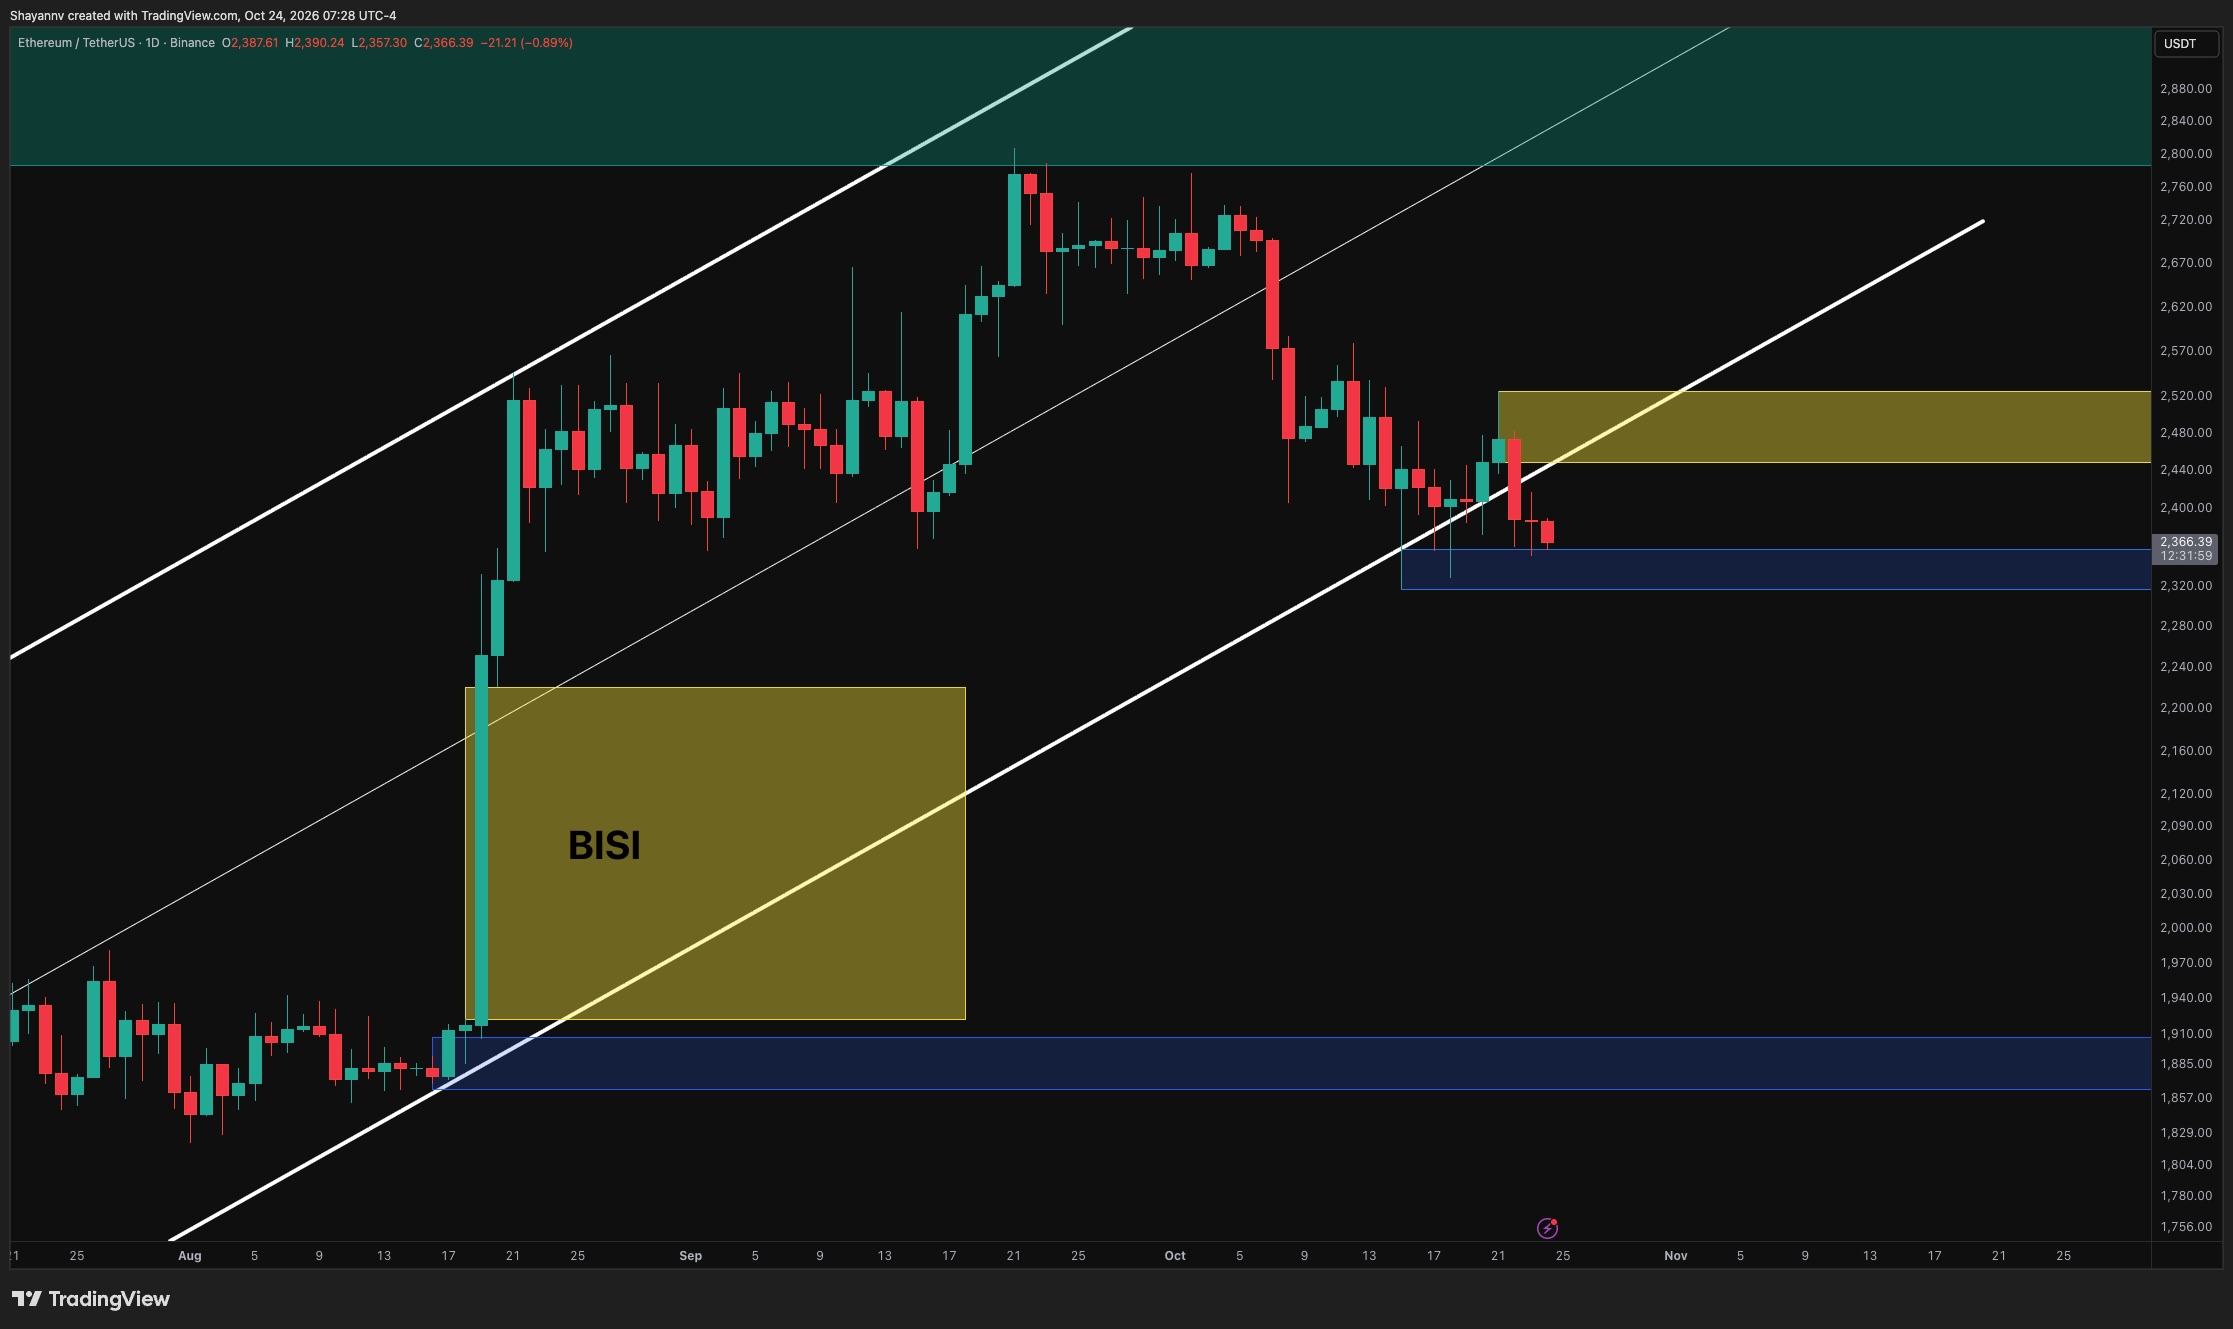
Ethereum’s failed rebound has given way to renewed selling, leaving the price near $2.37K and below its broader ascending channel. With futures taker activity also shifting toward sell dominance, the bearish continuation scenario remains favored unless buyers reclaim nearby resistance.
Ethereum Price Analysis: The Daily Chart
On the daily timeframe, Ethereum has broken beneath the ascending channel’s lower boundary after its latest recovery stalled inside the $2.44K–$2.52K supply zone. The subsequent bearish candles suggest that the rebound offered sellers another opportunity to reduce exposure, while buyers have struggled to restore the previous structure.
The immediate defense is now the highlighted $2.32K–$2.36K demand zone. A sustained close beneath this region would strengthen the breakdown scenario and expose the upper boundary of the marked bullish imbalance, or BISI, around $2.22K. This imbalance extends toward $1.92K and represents the area left behind by August’s rapid advance. A deeper retracement into it is possible if demand fails, although a complete fill is not guaranteed.
Conversely, holding nearby support could produce another relief bounce. However, ETH would need to reclaim the broken channel boundary and establish acceptance above the $2.44K–$2.52K supply zone to meaningfully weaken the bearish outlook.
ETH/USDT 4-Hour Chart
The 4-hour chart shows a clear sequence of lower highs, with the latest rebound rejected from the $2.47K–$2.5K supply zone. Ethereum has since fallen back toward the $2.32K–$2.36K demand region, keeping sellers in control of the immediate structure.
Repeated visits to this support have generated sharp reactions, but those rebounds have failed to establish sustained upside progress. A decisive break below $2.32K would confirm a fresh lower low and increase the likelihood of an extension toward the daily imbalance near $2.22K.
For buyers, recovering the $2.4K–$2.42K area would be an initial improvement, but the more important barrier remains $2.47K–$2.5K. Beyond that, a second supply zone at $2.54K–$2.58K could limit further gains. Until these lower-high regions are reclaimed, rebounds remain vulnerable to renewed selling.

Sentiment Analysis
The Ethereum Futures Taker CVD chart classifies whether aggressive buying or selling dominates over a rolling 90-day window. The latest observations have shifted from neutral to taker-sell dominant, shown by the red readings accompanying Ethereum’s retreat toward $2.4K.
This transition suggests that sell-initiated futures volume has gained the upper hand, reinforcing the weakness visible in the price structure. Unlike average order size, which identifies trade size without establishing direction, this metric provides evidence of dominant aggressive selling within the measured window.
Persistent sell dominance would support the risk of a breakdown through the $2.32K–$2.36K demand zone, particularly if buyers continue to struggle on rebounds. A shift back toward neutral or buy-dominant conditions, alongside a recovery through nearby supply, would provide stronger evidence that selling pressure is easing. For now, futures order flow supports a cautious, bearish bias.

Disclaimer: Information found on CryptoPotato is those of writers quoted. It does not represent the opinions of CryptoPotato on whether to buy, sell, or hold any investments. You are advised to conduct your own research before making any investment decisions. Use provided information at your own risk. See Disclaimer for more information.